Section 01
A DEM is a measured grid, not a finished landscape
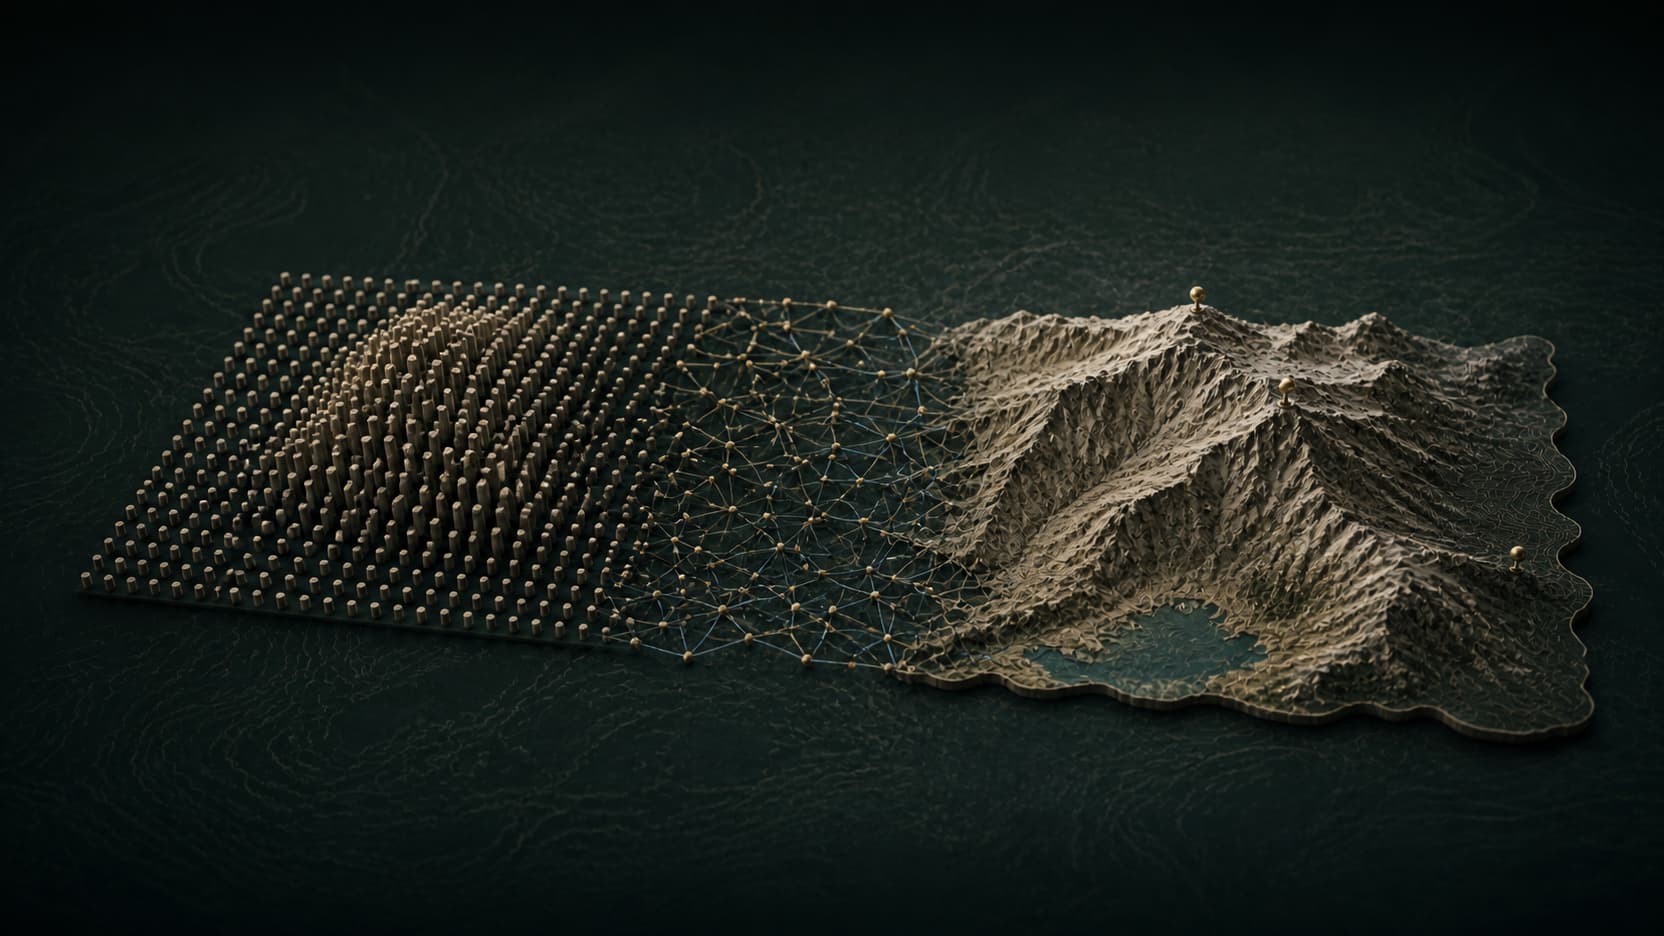
A digital elevation model stores a height value at each location in a regular grid. Depending on the product, those heights may represent bare earth or a surface that includes vegetation and structures. The grid also has a horizontal coordinate system, vertical reference, spacing, acquisition date and accuracy statement. Those properties matter more than how smooth the first render looks.
To create a 3D model, software maps each grid location to horizontal coordinates and uses the stored value as vertical position. Neighboring samples are then connected into triangles or retained as a grid surface. The result is a geometric interpretation of the source samples—not a new survey and not an infinitely detailed copy of the land.
- Horizontal resolution controls the spacing between elevation samples.
- Vertical accuracy describes uncertainty in height and is separate from grid spacing.
- Bare-earth DEMs and surface models answer different questions around trees and buildings.
Section 02
Inspect the source before choosing a mesh density
Find the best current source appropriate to the location and consequence. USGS 3DEP, for example, provides standard DEMs at multiple horizontal resolutions and source lidar products for covered areas in the United States. Other regions use different national, regional or commercial sources. Record the product name, date, resolution, vertical reference and use restrictions.
A dense mesh cannot recover landforms that the grid never sampled. Subdividing a coarse DEM creates more triangles but only interpolates between the same measurements. Conversely, keeping every point from a very large high-resolution dataset can overwhelm the browser or downstream tool without improving the intended view. Match mesh density to both the source and the output scale.
Section 03
Resolve coordinates, units and missing cells before triangulation
Elevation values have meaning only when horizontal coordinates and vertical units are interpreted correctly. Confirm whether horizontal positions are geographic or projected, whether elevation is in meters or feet, and which vertical datum applies. When combining sources, transform them deliberately instead of assuming their numbers share the same reference.
Handle no-data cells, water surfaces and tile boundaries before the final mesh. A missing cell should not silently become a deep pit. Adjacent tiles need consistent sampling along their shared edge or they may produce cracks. Hydro-flattened data can make lakes and wide rivers visually coherent, but it is still important to understand what the source processing changed.
Section 04
Crop first, then sample for the output you actually need
Choose the smallest geographic extent that contains the full job. Cropping early reduces processing and lets the available triangles describe the terrain that matters. For an interactive map, retain enough surrounding landform to preserve orientation. For a printable tile, keep a boundary that produces a stable shape and leaves the decisive ridges or coastlines intact.
Sampling is a tradeoff between fidelity and cost. A regular grid is simple and predictable. A triangulated irregular network can concentrate detail where the surface changes, especially when supplied with breaklines and boundaries. Whichever representation you use, compare the model at the final camera distance or physical size; invisible detail is not free.
Section 05
Triangulate the samples and inspect the terrain as geometry
Each group of neighboring samples becomes triangles whose vertices carry the elevation values. Triangle orientation, boundary continuity and normals affect how the surface renders and exports. Sharp seams, spikes or terraces may come from missing data, mismatched tiles, incorrect units or aggressive sampling—not from the real geography.
Inspect the terrain from several light directions. Low side light reveals ridges and sampling artifacts; a higher light helps judge the overall shape. Orbit the actual model rather than relying on a hillshade or color ramp alone. The interactive example below demonstrates why a change in camera and light can reveal landform that a flat preview hides.
Section 06
Use vertical exaggeration as a disclosed viewing choice
When a wide area contains modest relief, true vertical scale can look almost flat on screen. Vertical exaggeration multiplies height relative to horizontal distance so the landform becomes legible. It is useful for communication, but it also changes the apparent grade and should be recorded whenever the viewer might interpret slope or proportion.
Start near true scale, then increase only enough to reveal the intended pattern. Review cliffs, ridgelines, shorelines and built-up areas for distortion. Keep the numerical source elevation separate from the display multiplier so the underlying data is not permanently changed by a visual decision.
Section 07
Separate the terrain shape from its visual surface and handoff
Geometry defines the landform. Map imagery, color ramps, contours, material roughness, water and lighting explain it visually. Keep those layers conceptually separate: a sharper texture does not improve elevation accuracy, and a detailed mesh does not automatically contain roads, buildings or land cover. This makes it easier to change style without corrupting shape.
Choose the handoff by the next job. Use an interactive share or embed when the audience needs to orbit and explore. Export GLB when another 3D tool needs scene geometry and materials. For physical terrain, generate closed side walls and a flat base, set millimeter scale, and run a dedicated print-readiness check before downloading 3MF or STL. Preserve the source and transformation notes with every export.
Make3DMap generates browser terrain from available elevation and attributed map sources. Availability and detail vary by location, and the result is not a replacement for controlled survey or engineering data.
Evidence
Sources and further reading
Quick reference
Frequently asked questions
What is the difference between a DEM and a 3D terrain model?
A DEM is a grid of elevation samples with geographic metadata. A 3D terrain model connects or resamples those values into geometry and may add visual layers, scale choices and export-specific structure.
Does more triangles make elevation data more accurate?
No. More triangles can represent the available samples more smoothly, but they cannot add measurements that the source DEM did not contain. Accuracy comes from the source and processing chain.
Should I use vertical exaggeration?
Use it only when true scale hides the landform needed for the task. Keep it restrained, record the multiplier and avoid presenting the exaggerated surface as measured grade.